Water Quality
Indicators for Ecosystem Health
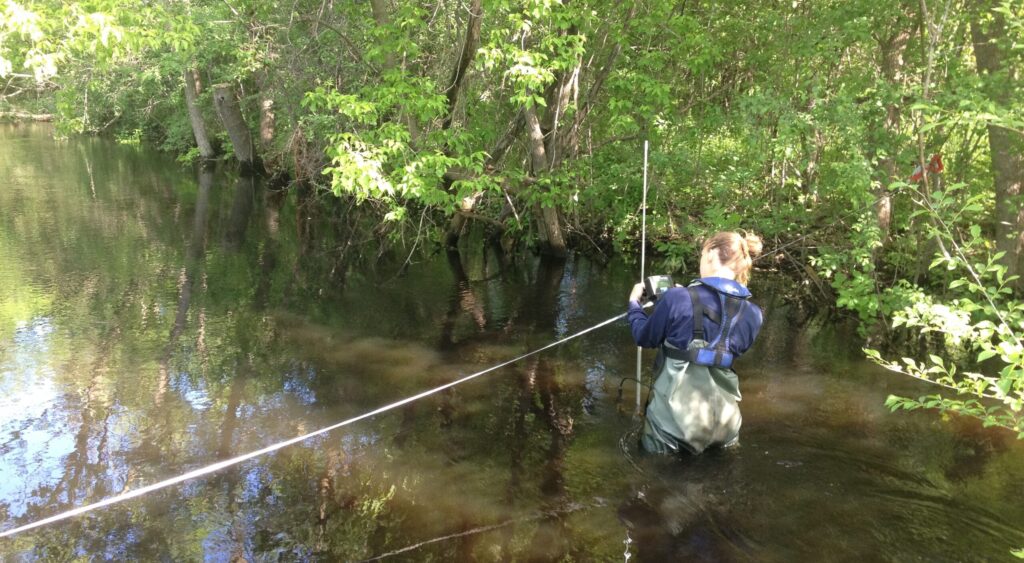
The Minnehaha Creek Watershed District (MCWD) collects and analyzes water quality data to support and direct improvement projects in areas of highest need. In Minnesota, there is a complex web of organizations working to protect and improve water resources. Our partners at the Minneapolis Park and Recreation Board, Three Rivers Park District, and the Minnesota Pollution Control Agency also monitor water quality throughout the Minnehaha Creek Watershed.
We collect data to determine the health of lakes and streams throughout the watershed. The core indicators used to analyze water quality in Minnesota vary between lakes and streams. Total phosphorus (TP), chlorophyll-a, and water clarity measurements serve as metrics to determine whether a lake is generally healthy or impaired. MCWD monitors levels of TP, total suspended solids, and nitrogen to determine the health of streams.
Excellent, good, poor, or degraded ecosystem health grades indicate the level to which stressors such as phosphorus have impacted the ecosystem. For water bodies with poor or degraded water quality, we work to identify what’s causing impairments and implement strategies for improvement with our partners. To learn more about the issues and drivers that result in water quality impairments and the strategies we use to address them across the watershed, visit our watershed strategies page.
No MCWD data to display
Ecosystem Health Key
Exceptional: Indicators show few signs of disturbance or stress. Ecosystem is providing numerous environmental benefits for wildlife and recreation.
Good: Indicators are beginning to show signs of disturbance or moderate stress. Ecosystem is providing environmental benefits for wildlife and recreation.
Poor: Indicators show obvious signs of disturbance and significant stress. Ecosystem is providing limited environmental benefits for wildlife and recreation.
Degraded: Indicators show high levels of disturbance and severe stress. Ecosystem is providing severely reduced benefits for wildlife and recreation.
Additional Data and Information
Spatial Data Access and Download
External Water Data Sources